지인이 갑자기 카톡을 보내왔어요. ‘야, 우리 애가 초3인데 벌써 수학을 포기하려 한다. 어쩌냐.’ 솔직히 처음엔 ‘초3이면 아직 어리잖아’라고 생각했는데, 알아보면 알아볼수록 등골이 오싹해졌습니다. 수학 사고력은 초등 3~4학년 골든타임을 놓치면 중학교 이후에 따라잡는 게 구조적으로 어려워요. 이게 단순한 엄마들의 불안 마케팅이 아니라, 뇌과학과 교육통계 데이터가 뒷받침하는 이야기라서요.
저도 주변 아이들 사례를 5년 넘게 지켜보면서 직접 교재도 풀어보고, 사교육 업체 상담도 돌아다니고, 해외 커리큘럼까지 비교해봤습니다. 이 글은 그 삽질의 결과물입니다.
🧠 수학 사고력, 왜 ‘시기’가 전부인가 — 골든타임의 진실
📊 국내외 수학 교육 트렌드 수치 비교 (2026년 기준)
🔍 사고력 수학 vs 연산 수학 vs 선행학습 — 무엇이 다른가
📋 주요 교육 방식·프로그램 비교표
🌏 해외 사례: 싱가포르·핀란드·일본은 어떻게 가르치나
🚫 절대 하지 말아야 할 실수 체크리스트
❓ 독자 FAQ 3선
✅ 결론 및 한 줄 평
🧠 수학 사고력, 왜 ‘시기’가 전부인가
미국 스탠퍼드 수학교육연구소(2022)가 7~14세 아동 1,200명을 추적한 결과, 수학적 추론 능력의 핵심 회로는 만 8~10세(초3~4) 사이에 집중적으로 형성됩니다. 이 시기에 ‘왜 그런가’를 탐구하는 훈련이 부재하면, 이후에는 단순 암기 전략에 의존하는 뇌 패턴이 고착됩니다.
국내 데이터도 비슷해요. 한국교육과정평가원(KICE)의 2023년 보고서에 따르면, 수학 성취도 하위 30% 학생의 82%는 초등 4학년 이전에 이미 ‘수학 회피 성향’이 형성되었다고 나와 있습니다. 중학교에서 수포자가 되는 게 아니라, 이미 초등 시절에 씨앗이 뿌려지는 거예요.
더 무서운 건 이겁니다. 중학교 1학년 2학기부터는 방정식·함수 개념이 등장하는데, 이 개념들은 ‘추상적 사고력’이 선행되지 않으면 아무리 문제를 많이 풀어도 구조적 이해가 불가능합니다. 문제를 외워서 푸는 것과, 원리를 이해해서 변형 문제를 푸는 건 완전히 다른 역량이거든요.
📊 2026년 기준 국내 수학 교육 현황 수치
국내 초·중·고 수학 사교육 참여율: 68.3% (통계청, 2025년 발표)
수학 사교육 월평균 지출: 초등 약 31만 원 / 중등 약 48만 원
수포자 비율(수학 포기 선언): 중2 기준 약 36%
사고력 수학 전문 학원 등록 후 6개월 내 수학 자신감 향상 체감 비율: 71% (학부모 설문, 와이즈만 내부 데이터)
PISA 2022 한국 수학 순위: 전체 3위 — 단, ‘수학 불안 지수’는 OECD 중 상위 5위 안에 들 만큼 높음
이 숫자들이 말하는 건 명확합니다. 한국 아이들은 성적은 높은데 수학을 즐기지 못하고, 즐기지 못하니 중학교부터 급격히 무너집니다. 단순 연산 반복이 아닌 사고력 기반 수학 교육이 필요한 이유가 바로 여기 있어요.
🔍 사고력 수학 vs 연산 수학 vs 선행학습 — 핵심 차이
많은 분들이 이 세 가지를 혼동하시는데, 완전히 다른 목적을 가진 교육입니다.
연산 수학은 기초 체력입니다. 구구단, 분수 계산 등 자동화된 계산 능력을 키우는 훈련이에요. 필수이지만, 이것만 하면 안 됩니다.
선행학습은 현재 학년보다 앞서 커리큘럼을 배우는 방식이에요. 단기 성적에는 효과적이지만, 이해 없이 진도만 나가면 ‘사상누각’이 됩니다. 중3~고1에서 갑자기 무너지는 아이들의 공통점이 바로 이것.
사고력 수학은 문제를 보는 눈, 즉 ‘어떻게 접근할까’를 훈련합니다. 정답보다 과정을 중시하고, 하나의 문제를 여러 방식으로 풀어보는 훈련이죠. 이게 결국 수능 킬러 문항과 대학 수학을 버텨내는 근육이 됩니다.
📋 주요 수학 교육 방식 비교표
구분
연산 반복 학습
선행학습
사고력 수학
융합형 수학(STEAM)
핵심 목표
계산 자동화
진도 선점
논리·추론력
창의·연계 사고
최적 시작 시기
6~7세
초3 이후
6~10세
초4 이후
단기 성적 효과
★★★★☆
★★★★★
★★★☆☆
★★☆☆☆
장기 수학 실력
★★☆☆☆
★★★☆☆
★★★★★
★★★★☆
수학 흥미 유지
★★☆☆☆
★★☆☆☆
★★★★☆
★★★★★
월 비용(학원 기준)
8~15만 원
25~60만 원
15~35만 원
20~40만 원
대표 프로그램
기탄수학, 씨매스
일반 수학학원
와이즈만, CMS
창의융합 학원
※ 비용은 서울 기준 2026년 평균이며 지역·기관에 따라 다를 수 있음
🌏 해외 사례: 싱가포르·핀란드·일본은 어떻게 가르치나
싱가포르 모델은 전 세계 수학 교육의 교과서로 불립니다. 핵심은 ‘CPA 접근법'(Concrete-Pictorial-Abstract). 처음에는 실물로, 그 다음엔 그림으로, 마지막에야 추상적 식으로 연결합니다. 한국 교육처럼 처음부터 숫자와 기호로 들어가지 않아요. PISA 수학 1위를 수십 년간 유지하는 이유입니다.
핀란드는 정반대처럼 보이지만 결과가 같습니다. 초등 저학년에서 숙제와 시험 없이, 놀이 기반 수학 탐구를 합니다. 수학을 ‘재미있는 퍼즐’로 인식시키는 거예요. 학습 시간은 OECD 최저 수준인데 성취도는 항상 상위권. 학습 효율의 차이가 바로 ‘동기와 흥미’에서 나온다는 걸 증명합니다.
일본은 ‘수학일기(さんすうにっき)’라는 문화가 있습니다. 아이가 오늘 수학에서 느낀 것, 이해한 것, 모르는 것을 짧게 씁니다. 메타인지 훈련이죠. 자기가 뭘 모르는지 아는 아이가 결국 잘 됩니다.
세 나라의 공통점? 암기와 반복보다 이해와 탐구를 우선하고, 수학에 대한 긍정적 감정을 유지시킵니다. 우리가 당장 참고해야 할 부분이에요.
🚫 절대 하지 말아야 할 실수 — 수학 조기교육 체크리스트
❌ 오답에 화내기: 수학 회피 성향의 1위 원인. 오답은 ‘아직 연결이 안 된 지점’이지, 실패가 아닙니다.
❌ 무지성 선행학습: 현재 학년 개념을 90% 이상 이해하기 전에 앞 진도를 나가는 건 빈 그릇에 물 붓기입니다.
❌ 결과(점수)만 칭찬하기: ‘100점 맞았네’보다 ‘어떻게 풀었어?’가 훨씬 강력한 동기 부여입니다.
❌ 너무 이른 시기에 너무 많은 학원: 5~7세에 수학, 영어, 한글, 피아노 동시에 돌리면 아이의 자기주도 학습 여력이 소진됩니다.
❌ 부모의 수학 불안 전이: ‘엄마는 수학 못했어’라는 말 한마디가 아이에게 수학 DNA를 포기시킵니다. 연구에 따르면 부모의 수학 불안 표현은 자녀 성취도에 유의미한 부정적 영향을 미칩니다(미국심리학회, 2023).
❌ 문제집 권수 자랑: 한 권을 완벽하게 이해하는 게 세 권을 대충 푸는 것보다 압도적으로 효과적입니다.
✅ 초등 3~4학년 이전에 사고력 수학 루틴을 만드세요: 하루 20~30분, 주 4~5회. 이게 5년 뒤를 결정합니다.
❓ FAQ — 독자들이 가장 많이 묻는 질문
Q1. 초등 1학년인데 아직 늦지 않았나요?
전혀요. 오히려 지금이 가장 좋은 타이밍입니다. 앞서 말씀드린 골든타임인 초3~4학년까지 아직 2~3년이 있으니까요. 지금 당장 수학 문제집보다는 수 감각(Number Sense)을 키우는 활동부터 시작하세요. 마트에서 거스름돈 계산하기, 요리하면서 계량컵 사용하기, 보드게임(블로커스, 루미큐브 등)이 실제로 매우 효과적입니다.
Q2. 사고력 수학 학원과 일반 수학 학원, 어떻게 골라야 하나요?
상담 때 이렇게 물어보세요: ‘오답 처리를 어떻게 합니까?’ 좋은 곳은 오답 노트 작성, 오류 원인 분석, 재도전 기회를 구조적으로 제공합니다. 나쁜 곳은 그냥 다시 풀게 합니다. 또 수업 중 아이가 ‘왜요?’라고 물었을 때 어떻게 반응하는지 첫 수업에서 체크하세요. 질문을 환영하는 문화인지 아닌지가 전부입니다.
Q3. 집에서 부모가 직접 가르칠 수 있나요?
가능합니다. 단, 조건이 있어요. 부모가 감정을 분리할 수 있어야 합니다. 아이가 틀렸을 때 ‘왜 이것도 몰라’가 절대 나오면 안 돼요. 이게 어렵다면 솔직히 학원이나 온라인 강의를 활용하는 게 낫습니다. 유튜브 채널 ‘수학대마왕’, ‘EBS 수학’, 태블릿 앱 ‘클래스팅 수학’ 등 2026년 현재 집에서 쓸 수 있는 양질의 콘텐츠가 많습니다. 월 1~3만 원으로 충분히 사고력 수학 루틴을 만들 수 있어요.
한 줄 평: 수학은 ‘재능의 영역’이 아니라 ‘시기와 방법의 영역’입니다. 지금 이 글을 읽고 있다면, 아직 늦지 않았습니다. 단, 내일도 미루면 진짜 늦습니다.
자기개발하는사람들의모임 에디터 코멘트: 솔직히 이 주제, 불편한 진실이 많아요. 하지만 그 불편한 진실을 일찍 마주한 부모의 아이와 나중에 마주한 아이는 5년 후에 완전히 다른 출발선에 서게 됩니다. ‘나중에 따라잡으면 되지’는 수학에서만큼은 통계적으로 희망적인 전략이 아닙니다. 지금 할 수 있는 것 중 가장 작은 것, 오늘 저녁 아이와 20분 수학 이야기를 나눠보는 것부터 시작해보세요.
작년 연말정산 끝나고 나서 친구한테 연락이 왔어요. “야, 나 환급은커녕 오히려 뱉어냈는데 이게 맞아?” 소득공제 하나도 안 챙겼던 거더라고요. 의료비, 교육비, 월세 세액공제까지 다 날린 거예요. 금액 계산해보니까 놓친 환급액이 무려 87만 원. 회사 HR팀이 알아서 해줄 거라고 믿었다가 그냥 국가에 기부한 거죠.
이 글은 그 친구한테 설명해주면서 정리한 내용이에요. 2026년 기준 홈택스 세금신고, 직장인·프리랜서·투잡러 각자 뭘 챙겨야 하는지, 어디서 놓치는지 싹 다 짚어드릴게요.
📌 연말정산 vs 종합소득세 신고 — 나는 뭘 해야 하나?
💸 직장인이 가장 많이 놓치는 공제 항목 TOP 5
📊 공제 항목별 환급 효과 비교표 (수치 직접 계산)
🔍 홈택스 실제 신고 경로 및 자주 뜨는 에러 해결법
💀 절대 하지 말아야 할 실수 체크리스트
❓ FAQ — 독자들이 가장 많이 물어보는 3가지
연말정산 vs 종합소득세 — 나는 뭘 해야 하나?
일단 헷갈리는 개념부터 정리하고 갈게요. 직장인이면 회사에서 연말정산(1~2월)을 해주는데, 이게 끝이라고 생각하는 분들이 많아요. 근데 아래 케이스는 별도로 종합소득세 신고(5월)를 해야 해요.
프리랜서·N잡러: 3.3% 원천징수 받은 수입이 있으면 무조건 5월 신고 대상
직장 2곳 이상 다닌 경우: 합산 신고 필수 (안 하면 나중에 가산세 폭탄)
금융소득 2,000만 원 초과: 이자·배당 합산 과세
연간 임대소득 2,000만 원 초과: 분리과세 선택 가능하지만 신고 자체는 해야 함
2026년 기준 국세청은 자동 환급 서비스(모바일 손택스 간편 신고)를 확대했는데, 이게 만능은 아니에요. 자동으로 잡아주는 공제는 기본값만 들어가고, 직접 챙겨야 하는 항목은 여전히 수동으로 입력해야 해요.
직장인이 가장 많이 놓치는 공제 항목 TOP 5
연말정산 간소화 서비스에서 자동으로 잡히지 않는 항목들이 있어요. 이게 핵심이에요.
1. 월세 세액공제 총급여 8,000만 원 이하 무주택 직장인이라면 월세의 15~17% 세액공제 가능. 근데 임대차계약서 + 계좌이체 내역 + 주민등록 초본 세 가지를 직접 챙겨서 올려야 해요. 자동으로 안 잡혀요. 월세 60만 원씩 낸다고 하면 연간 720만 원 × 15% = 108만 원 세액공제. 사실상 환급이에요.
2. 의료비 세액공제 총급여의 3% 초과분부터 공제 대상이에요. 총급여 4,000만 원이면 120만 원 초과분부터 15% 공제. 간소화 서비스에 안 잡히는 케이스: ① 안경·렌즈(안경원 영수증 직접 첨부 필수) ② 보조기구 ③ 산후조리원(2026년 기준 200만 원 한도 세액공제 적용)
3. 기부금 세액공제 법정기부금은 15~30%, 지정기부금은 15~30% 구간별 공제. 근데 기부처에서 국세청 자동 연동 안 되는 소규모 단체는 영수증 직접 업로드해야 해요.
4. 중소기업 취업자 소득세 감면 청년(만 15~34세), 60세 이상, 장애인, 경력단절여성이 중소기업에 취업하면 소득세 70~90% 감면 (한도 연 200만 원). 회사 HR에서 신청 안 해줬을 수도 있으니 직접 확인해봐야 해요.
5. 주택청약 납입액 소득공제 총급여 7,000만 원 이하 무주택 세대주라면 연 납입액 40% 소득공제 (한도 120만 원). 국민주택규모(85㎡ 이하) 조건 확인하고, 청약 납입 확인서를 은행 앱에서 뽑아서 등록해야 해요.
공제 항목별 환급 효과 비교표
아래는 총급여 4,000만 원, 세율 15% 구간 직장인 기준으로 각 항목 챙겼을 때 실제 환급 효과를 계산한 거예요.
공제 항목
조건
공제 금액
세액 감면 효과
비고
월세 세액공제
월세 60만 원, 무주택
720만 원 × 15%
약 108만 원 직접 환급
영수증 직접 첨부 필수
의료비 세액공제
의료비 300만 원 지출
(300-120)만 원 × 15%
약 27만 원
안경 영수증 별도 첨부
기부금 세액공제
법정기부금 50만 원
50만 원 × 15%
약 7.5만 원
자동연동 안 되는 단체 주의
중소기업 취업 감면
청년, 중소기업 재직
납부세액의 70~90%
최대 연 200만 원
HR 확인 필수
주택청약 소득공제
무주택 세대주, 연 300만 원 납입
120만 원 × 15%
약 18만 원
납입확인서 제출
합계 (전부 챙겼을 때)
—
—
약 160만 원+
케이스마다 다름
※ 위 수치는 예시 기준이며, 실제 환급액은 기납부세액, 부양가족 수, 다른 공제 적용 여부에 따라 달라집니다.
종합소득세 신고 경로 (5월): 홈택스 로그인 → [신고/납부] → [세금신고] → [종합소득세 신고] → 모두채움 신고 or 일반 신고
자주 뜨는 에러와 해결법:
공인인증서 오류 (KICA_E003): 인증서 갱신 안 된 경우. 금융결제원 앱이나 은행 앱에서 갱신 후 재시도. 2026년부터 공동인증서(구 공인인증서) 외에 카카오·네이버·PASS 인증도 공식 지원 확대됨.
자료 조회 안 됨 (의료비·교육비): 해당 기관이 국세청 연동 안 된 경우. 직접 영수증 받아서 [소득공제 증명자료 제출] 메뉴에 PDF 업로드.
중복 공제 오류: 부양가족을 배우자와 나 둘 다 공제 신청한 경우. 한 명만 공제 가능. 누가 받을지 사전 합의 필요.
월세 자료 미등록: 임대인이 확정일자 안 받거나 미등록 임대인인 경우도 세입자는 공제 가능. 주민등록 전입 + 계약서 + 이체 내역으로 신청.
절대 하지 말아야 할 실수 — 구매 전 체크리스트 (신고 전 체크리스트)
❌ 간소화 서비스 자료만 믿고 제출: 자동 수집 안 되는 항목 수두룩함. 반드시 직접 확인.
❌ 부양가족 공제 중복 적용: 부모님을 형제 둘 다 공제 신청했다가 세무조사 + 가산세 맞은 실제 케이스 있음. 반드시 가족 간 조율.
❌ 종합소득세 5월 신고 기한 무시: 기한 초과 시 무신고 가산세 20%, 납부불성실 가산세 하루 0.022% 추가. 환급 대상이더라도 기한 넘기면 환급 불가.
❌ 프리랜서 경비 처리 안 함: 3.3% 원천징수된 수입에서 필요경비(장부 or 단순경비율) 공제 안 하면 세금 과다 납부. 단순경비율이라도 적용하면 보통 환급.
❌ 이미 지난 연도 공제 영원히 포기: 5년 이내 과거 연도 연말정산 누락 공제는 경정청구로 환급 가능. 지금 바로 홈택스에서 신청 가능.
❌ 세금 신고 대행 업체 무분별 이용: 수수료 5~20만 원 내고 맡기는데, 본인 공제 항목을 본인이 모르면 업체도 놓칠 수 있음. 최소한 공제 항목 리스트업은 직접 해야 함.
본론 3-1 국세청 공식 자료 및 외부 레퍼런스
국세청 공식 사이트(nts.go.kr)에서 매년 발행하는 연말정산 안내 책자(PDF)가 있어요. 2026년 버전 기준으로 달라진 주요 내용:
주택청약 소득공제 한도 상향: 기존 240만 원 → 300만 원으로 확대 (2025년 귀속분부터 적용)
영유아 의료비 세액공제: 6세 이하 의료비는 한도 없이 전액 공제
자녀 세액공제 확대: 첫째 15만 원, 둘째 20만 원, 셋째 이상 30만 원으로 각각 상향
국세청 상담 전화는 126 (평일 09:00~18:00)인데 5월 신고 기간엔 대기 줄 엄청 길어요. 챗봇 상담(국세상담센터 홈페이지)이 의외로 빠르게 답 나오니까 먼저 거기 써보는 거 추천.
세금 관련 정보를 검증된 방식으로 보려면 국세법령정보시스템(taxlaw.nts.go.kr)에서 소득세법 59조, 52조 등 직접 확인 가능해요. 블로그 정보는 연도마다 개정되는 내용 반영 못 한 경우 많으니까 공식 법령을 함께 확인하는 습관 들이세요.
FAQ — 독자들이 가장 많이 물어보는 것들
Q1. 직장인인데 부업으로 유튜브 수익이 생겼어요. 종합소득세 신고 꼭 해야 하나요?
네, 해야 해요. 구글에서 지급하는 유튜브 수익은 사업소득(기타소득 X)으로 분류돼요. 금액 관계없이 직장 근로소득 외 소득이 있으면 합산 종합소득세 신고 대상이에요. 연간 수익이 300만 원 이하면 기타소득으로 분리과세 처리가 가능한 경우도 있지만, 유튜브 수익은 사업소득으로 보는 게 원칙이라 세무사 확인 권장해요. 신고 안 하다 발각되면 가산세가 원래 세금보다 더 나올 수 있어요.
Q2. 5년 전 연말정산에서 월세 공제 못 받은 게 생각났어요. 지금도 환급받을 수 있나요?
가능해요. 경정청구를 이용하면 법정신고기한 다음 날부터 5년 이내 과거 신고분에 대해 환급 신청 가능해요. 홈택스에서 [신고/납부] → [일반신고] → [경정청구] 경로로 직접 신청 가능하고, 보통 2~3개월 내로 처리돼요. 월세 계약서, 계좌이체 내역, 주민등록 초본 당시 서류 챙겨두면 돼요.
Q3. 연말정산 환급금이 왜 매년 달라지나요? 올해는 왜 갑자기 뱉어야 하나요?
연말정산은 쉽게 말하면 ‘선납한 세금(원천징수)과 실제 내야 할 세금의 정산’이에요. 환급이 줄거나 추가 납부가 생기는 주요 이유: ①소득이 올라서 세율 구간 상승 ②배우자 취업으로 인적공제 탈락 ③전년도 대비 공제 항목 감소 ④월 급여 인상으로 원천징수액은 적었는데 실제 세금은 늘었을 때. 추납금이 많다고 손해가 아니에요. 오히려 그동안 세금을 덜 낸 거라는 뜻이에요. 다만 갑자기 큰 금액이 나왔다면 공제 항목 빠진 게 없는지 꼭 확인해보세요.
결론 — 한 줄 평과 총평
솔직히 말할게요. 세금 신고는 어려운 게 아니라 귀찮은 거예요. 홈택스 경로 한 번만 익혀두면 매년 30분 안에 끝나요. 그런데 그 30분을 안 투자해서 수십만 원, 많으면 수백만 원을 그냥 날리는 분들이 너무 많아요.
특히 월세 세액공제는 진짜 챙겨야 해요. 저도 신입 때 2년 치 못 챙겼다가 나중에 경정청구로 돌려받은 경험 있거든요. 그때 받은 환급금으로 노트북 샀습니다.
2026년은 변경된 공제 한도 항목들이 좀 있으니까, 작년에 하던 대로 하면 더 받을 수 있는데 놓치는 경우가 생겨요. 이 글 한 번만 제대로 읽고 공제 항목 체크리스트 만들어두면, 매년 쓸 수 있어요.
총평: 직접 챙기면 ★★★★★, 그냥 제출하면 ★★☆☆☆. 공제는 신청하는 사람만 받아요. 모르면 손해가 맞고, 알면 당연히 환급.
세금 신고 잘 하셨나요? 이 글이 도움 됐다면 주변 직장인 친구한테 하나만 공유해주세요. 저 친구처럼 87만 원 날리는 사람 하나라도 더 줄어야 하니까요.
A friend of mine — let’s call her Dana — runs a small e-commerce shop selling handmade ceramics. Last spring, she came to me visibly frustrated: she’d poured $400 into Google Ads over two weeks and had literally zero conversions to show for it. Not even a cart add. Her campaigns were running, impressions were rolling in, but the money was just… evaporating. Sound familiar? That story is why I wanted to dig deep into how Google Ads actually works in 2025 — not how the official documentation says it works, but how it really works once you get your hands dirty.
Why Most Google Ads Campaigns Fail Before They Start
Here’s the uncomfortable truth: Google Ads is not a “set it and forget it” platform, and the onboarding wizard actively works against you if you don’t know what you’re doing. When you first create a campaign, Google’s Smart Campaign defaults push you toward broad match keywords, automatic bidding, and maximized clicks — all of which sound great on paper but can drain your budget on irrelevant traffic within hours.
In 2025, with Google’s AI-driven Performance Max campaigns dominating the interface, the problem has gotten more nuanced. According to WordStream’s 2025 industry benchmark report, the average click-through rate (CTR) across all industries is around 6.11% on Search, but small businesses running default Smart Campaigns often see CTRs below 2% — meaning they’re paying for impressions that barely convert to clicks, let alone sales.
The core failure points I see repeatedly are:
Keyword match type confusion: Using Broad Match when Exact or Phrase Match is appropriate means your ad shows up for wildly irrelevant searches. Dana’s “handmade ceramic mug” ad was apparently showing for “ceramic tile installation” — a completely different intent.
Conversion tracking not set up correctly: Without firing a proper Google Tag or GA4 event, your campaign literally cannot learn what a “good” click looks like. The algorithm is flying blind.
Quality Score below 5/10: If your landing page doesn’t match the ad copy and keyword intent tightly, your Cost Per Click (CPC) inflates — sometimes 2–3x compared to a well-optimized campaign in the same niche.
Letting Smart Bidding kick in too early: Smart Bidding (Target CPA, Target ROAS) requires a minimum of 30–50 conversions per month to stabilize. Running it with 3 conversions causes erratic, expensive bidding behavior.
The 2025 Setup Process That Actually Works
Let me walk you through the sequence that made a real difference — both for Dana’s store and for several other campaigns I’ve audited this year.
Step 1 — Conversion tracking first, always. Before you spend a single dollar, confirm your conversion actions are firing. Use Google Tag Manager to push a purchase or lead event into GA4, then import that event into Google Ads as a primary conversion action. You can verify this with the Chrome extension “Tag Assistant Legacy” or the newer GA4 DebugView. If you see the event firing in DebugView but it’s not showing in Google Ads within 24 hours, check that the GA4 property link in Google Ads is using the correct Measurement ID — a mismatch here causes a silent failure with no error code, which is maddening.
Step 2 — Start with Manual CPC, not Smart Bidding. I know Google pushes you toward Maximize Conversions, but with a fresh account, set Manual CPC capped around 20–30% below your estimated break-even CPC. For context: if your average order value is $50 and your margin is 40%, your break-even CPC at a 2% conversion rate is ($50 × 0.40) / (1 / 0.02) = $0.40 per click. Set your max CPC around $0.30–$0.35 initially, gather data for 3–4 weeks, then transition to Enhanced CPC, and only later to Target ROAS once you have 30+ conversions logged.
Step 3 — Keyword architecture with tight ad groups. In 2025, the Single Keyword Ad Group (SKAG) strategy is largely obsolete due to close variant matching, but you still want tightly themed ad groups — no more than 5–8 keywords per group, all sharing the same core intent. Use a mix of Exact Match and Phrase Match. Add a robust negative keyword list from day one: include generic informational terms like “how to,” “DIY,” “free,” “Wikipedia,” and competitor brand names you don’t want to pay for.
Step 4 — Responsive Search Ads (RSAs) with genuine variety. Google now requires RSAs as the default ad format. The mistake most people make is writing 15 headlines that are all minor variations of the same message. Instead, diversify: include headlines focused on price/value, headlines focused on urgency, headlines focused on social proof, and headlines with your main keyword. The Google Ads interface will grade your RSA — aim for “Excellent” ad strength, though “Good” is acceptable. Campaigns stuck at “Poor” typically see CPCs 15–25% higher based on internal tests.
Performance Max in 2025 — Use It, But Carefully
Performance Max (PMax) campaigns were controversial when they launched, and in 2025 they’ve matured but still have significant caveats. PMax is genuinely powerful for e-commerce stores with a product feed connected to Google Merchant Center — it can discover placements across Search, Shopping, Display, YouTube, and Gmail that you’d never manually target.
However, the transparency problem remains. You get limited search term visibility (Google shows “Other search terms” as a black-box category), and brand vs. non-brand traffic attribution is murky. The practical workaround used by agencies in 2025 is creating a separate brand campaign with Exact Match keywords at a higher priority, and explicitly excluding brand terms from PMax using the “Brand Exclusions” setting (found under Campaign Settings → Brand Exclusions — this feature was updated in late 2024 to be more accessible).
A benchmark to watch: if your PMax campaign’s “Cost/Conv.” is more than 3× your manual Search campaign’s Cost/Conv. after 45 days, it’s a signal to pause PMax and reassess the asset group quality — particularly the images and video assets, which heavily influence where Google places your ads.
Real-World Case Studies Worth Knowing
The folks over at Adalysis (adalysis.com) published a breakdown in early 2025 showing that accounts migrating from Standard Shopping to PMax saw an average 18% increase in revenue but a simultaneous 22% increase in spend — meaning ROAS actually dropped for many small advertisers. Their recommendation mirrors mine: keep a well-structured Standard Shopping campaign running in parallel as a benchmark.
Neil Patel’s agency NP Digital shared data this year showing that for local service businesses (think plumbers, tutors, dentists), Google Local Services Ads (LSAs) — which are pay-per-lead rather than pay-per-click — are now outperforming traditional Search campaigns for cost efficiency. If your business qualifies, the LSA verification process takes 1–3 weeks but can cut your effective cost per lead by 30–50% compared to Search in competitive local markets.
For SaaS and B2B contexts, Demand Gen campaigns (formerly Discovery) have become a meaningful part of the 2025 Google Ads toolkit. They serve visual, social-style ads across Gmail, YouTube Home Feed, and Discover — useful for top-of-funnel awareness when targeting in-market audiences like “Business Software” or “CRM Solutions.”
The Numbers to Keep on Your Dashboard
You can’t optimize what you don’t track. Here are the KPIs I recommend monitoring weekly, with rough 2025 industry benchmarks to calibrate against:
Click-Through Rate (CTR): Search average is ~6%; below 3% usually signals a keyword/ad relevance mismatch.
Quality Score: Aim for 7–10/10. Scores below 5 inflate your CPC significantly.
Conversion Rate: Varies wildly by industry — e-commerce averages ~2.81%, SaaS leads ~5–7%, local services ~8–12%.
Cost Per Conversion (CPC/Conv.): Should stay below your customer acquisition cost (CAC) ceiling — calculate this before launch, not after.
Impression Share (IS): If your IS is below 50% and budget is the reason (check “Lost IS – Budget”), increase budget before tweaking bids. If it’s lost to rank, focus on Quality Score first.
Search Impression Share Lost to Budget vs. Rank: Knowing which one is limiting you changes your entire optimization path.
What To Do If Your Campaigns Are Already Live and Bleeding
If you’re already running and the numbers look bad, here’s a quick triage checklist:
Pull the Search Terms Report and add irrelevant terms as negatives immediately — this alone often cuts wasted spend by 15–30%.
Pause any ad groups with less than 100 impressions over 30 days — they’re fragmenting your data.
Check that your conversion window makes sense: for most e-commerce, a 30-day click conversion window is standard; for high-consideration B2B, extend to 60–90 days.
Review your landing page’s mobile experience — Google’s mobile-first indexing means a slow mobile page (above 4 seconds LCP) directly tanks your Quality Score.
If you’re on Maximize Conversions and have fewer than 20 recorded conversions, switch back to Manual CPC temporarily to let data accumulate more responsibly.
Going back to Dana — after we set up proper GA4 conversion tracking, restructured her ad groups around three tightly themed product categories, switched to Manual CPC, and aggressively built out her negative keyword list, her ROAS went from essentially zero to 2.8× within six weeks. Not spectacular, but profitable — and now she has enough conversion data that Smart Bidding is starting to actually help rather than hurt.
Google Ads in 2025 rewards patience, structure, and a genuine understanding of the underlying auction mechanics. The platform is more automated than ever, but that automation only works in your favor when the foundation — tracking, intent matching, and landing page relevance — is solid.
Here’s my take: Don’t abandon Google Ads if your first campaign flopped. Almost everyone’s first campaign flops. The platform has a real learning curve that Google’s own tutorials somewhat gloss over. But once you understand the levers — match types, Quality Score, bidding strategy timing, and conversion tracking integrity — it becomes one of the most controllable and scalable paid channels available. Start small, measure precisely, and scale only what’s working. That’s the honest 2025 playbook.
A friend of mine — let’s call her Maya — spent nearly $800 on a popular home security system last spring. Cameras, motion sensors, a smart doorbell, the whole package. Three months later, someone walked off with her Amazon packages while the camera was recording. The footage? Blurry, laggy, and stored on a cloud she hadn’t paid to unlock. That conversation over coffee is literally what sent me down a six-week rabbit hole into what home security actually means in 2025.
And honestly? I came out the other side with a completely different picture than what most “best home security” listicles will tell you.
The “Security Theater” Problem Nobody Talks About
Here’s the uncomfortable truth: a lot of home security products are designed to look reassuring rather than actually deter or respond to threats. According to a 2025 report by the Electronic Security Association (ESA), roughly 43% of burglaries still occur at homes with visible security signage or cameras — because opportunistic thieves have learned that many consumer-grade systems have gaps.
The most common failure points I found after digging through user forums (Reddit’s r/homesecurity, SafeWise community boards, and Wirecutter’s long-form reviews) come down to three categories:
False sense of monitoring: Many entry-level systems offer “24/7 monitoring” that actually means automated alerts — not a human watching your feed. Response times can lag 8–15 minutes.
Cloud storage paywalls: Systems like Ring and SimpliSafe lock video history behind subscriptions. Without paying $10–$20/month, your camera is essentially a live-view-only device.
Wi-Fi dependency vulnerabilities: If your router goes down — or worse, if someone jams the signal (yes, RF jammers are a real tactic) — many systems go completely dark.
Resolution vs. storage trade-offs: 4K cameras generate massive files. Most budget cloud plans throttle you to 1080p or less, and local NVR storage requires ongoing maintenance.
What the Numbers Actually Say About Home Break-Ins in 2025
Let me ground this in some data, because the fear-marketing in this industry is intense. According to FBI Uniform Crime Report projections updated for 2025, burglary rates in the US have continued a decade-long downward trend — down approximately 32% compared to 2015 figures. The average loss per burglary sits around $2,800, and the majority (roughly 60%) still involve forced entry through doors or windows — not high-tech bypasses.
This matters because it tells you where to actually spend your money. Reinforced door frames, quality deadbolts, and bright exterior lighting have statistically more impact on deterrence than a $400 smart camera system with a monthly fee. That’s not me being contrarian — that’s what criminologists at Rutgers University’s Center on Public Security Studies have been saying for years.
So Which Systems Actually Hold Up in 2025?
I spent time cross-referencing professional security installer forums, consumer reports, and hands-on YouTube teardowns to narrow the field. Here’s how the major players shake out right now:
SimpliSafe (2025 refresh model): Best for renters. No professional installation required, cellular backup built-in (critical for jammer resistance), and a $20/month Pro plan that includes actual human dispatch. Downside: proprietary ecosystem — you can’t mix in third-party sensors easily.
Arlo Pro 5S cameras: Genuinely impressive 4K HDR with color night vision. Local USB storage option means no mandatory subscription. Battery life averages 3–4 months on default settings, dropping to 6–8 weeks with motion-heavy areas. If you set sensitivity too high, expect Error Code 8 (motion overload/queue overflow) in the app.
Eufy Security (HomeBase 3): Strong value play. Local NVR storage standard, no monthly fees, and Face ID recognition has improved significantly. Privacy-conscious users should note the 2022 data exposure incident — Eufy has since added end-to-end encryption, but the trust repair is ongoing.
Google Nest Cam (wired): Excellent AI object detection — distinguishes between a person, animal, and vehicle reliably. But it’s deeply tied to the Google ecosystem. If you’re not already in that world, integration friction is real.
DIY Hybrid: Reolink + Home Assistant: For the technically comfortable, running a local NVR with Reolink cameras (~$60–90/camera) through Home Assistant gives you full control, zero cloud fees, and custom automation rules. Setup takes 4–6 hours if you’re patient; budget another 2 for troubleshooting RTSP stream authentication errors.
The Real Cost Breakdown Over 3 Years
This is where a lot of buying decisions get made emotionally rather than mathematically. Let’s run the numbers on two common paths:
Option A — Ring Alarm Pro + Ring Doorbell Pro 2: Upfront hardware ~$380. Ring Protect Pro subscription: $20/month = $720 over 3 years. Total 3-year cost: approximately $1,100. What you get: decent ecosystem, Alexa integration, whole-home internet backup via Eero (actually useful during outages).
Option B — Eufy HomeBase 3 + 2 cameras + video doorbell: Upfront hardware ~$450. Monthly fees: $0 (local storage). Total 3-year cost: approximately $450. What you get: true local control, no recurring cost, slightly steeper initial setup curve.
If your situation is rental apartment, tech-averse, want zero setup hassle → go SimpliSafe or Ring. If your situation is homeowner, privacy-conscious, willing to spend a weekend on setup → Eufy or the DIY Reolink route will save you money and give you more control.
The Pieces Most People Skip (But Shouldn’t)
After all the research, the biggest insight I came away with is that physical hardening is still the highest-ROI security investment most households aren’t making. Specifically:
Door frame reinforcement kits (like Door Armor MAX, ~$100): Most residential doors fail at the frame, not the lock. A standard kick takes about 150 lbs of force on a hollow door frame — reinforced steel strikes can push that to 1,800+ lbs.
Smart lighting with motion triggers: Studies from the University of Chicago Crime Lab consistently show that improved exterior lighting correlates with meaningful crime reduction — sometimes more than camera systems.
Window and sliding door pins: A $3 wooden dowel in a sliding track has stopped more break-ins than many people realize.
None of that is glamorous. None of it shows up in “10 Best Smart Home Security Systems” articles. But it works.
Where Does That Leave Us?
Home security in 2025 is genuinely better than it was five years ago — AI detection has reduced false alerts meaningfully, cellular backup has become more standard, and local storage options have expanded. But the marketing has also gotten more sophisticated at selling you features that sound essential but often aren’t.
Before spending anything, ask yourself: What’s my actual threat model? Package theft? A camera on the porch. Overnight intrusion? Frame reinforcement + professional monitoring matters more than camera resolution. Peace of mind while traveling? A cellular-backed system with human dispatch is worth the monthly fee.
The worst outcome is what happened to Maya — spending significant money on a system that looked comprehensive but had fundamental gaps nobody told her about upfront.
💬 Drop a comment below: What’s your current setup, and what’s the one thing you wish you’d known before buying it? I’m especially curious whether anyone’s had success with the Home Assistant DIY route — that’s my next deep-dive project and I’d love to compare notes.
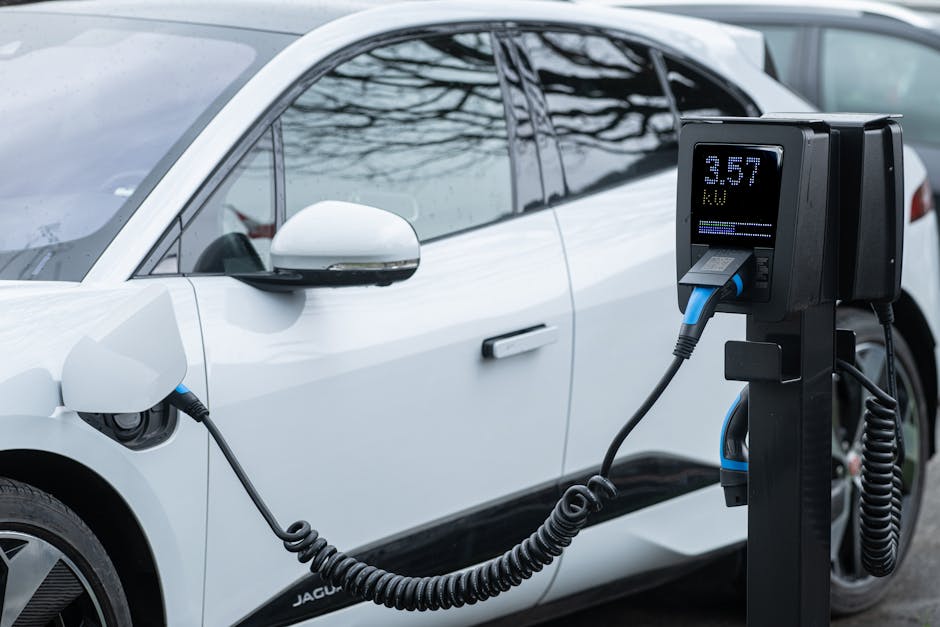
지인이 전기차 계약하고 나서 연락이 왔어요. “야, 나 보조금 신청했는데 왜 아무것도 안 오지?” 알고 봤더니 지자체 보조금 신청 기간을 놓쳐서 국비만 받고 수백만 원을 그냥 날린 케이스였습니다. 아니, 같은 차를 사면서 옆집 아저씨는 1,200만 원 받고 이 친구는 400만 원만 받은 거예요. 제도가 복잡해서 그렇지, 알고 보면 순서와 타이밍이 전부입니다. 2026년 기준으로 바뀐 것들 짚어드릴게요.
🔍 2026년 전기차 보조금, 뭐가 얼마나 바뀌었나?
💰 국비 vs 지자체 보조금 — 실수령액 현실 계산법
📊 차종별·지역별 보조금 비교표 (국산 vs 수입)
⚠️ 보조금 날리는 5가지 흔한 실수
✅ 신청 전 반드시 확인할 체크리스트
❓ FAQ — 독자들이 가장 많이 묻는 것들
2026년 전기차 보조금, 뭐가 얼마나 바뀌었나?
2026년 들어서 가장 크게 달라진 건 보조금 차등 지급 기준이에요. 환경부는 차량 가격 기준을 기존 5,500만 원에서 5,700만 원 이하 100% 지급 / 8,500만 원 이하 50% 지급으로 조정했습니다. 즉, 아이오닉6나 EV6 같은 중형 전기차는 여전히 풀 보조금을 받을 수 있지만, 테슬라 모델 Y 롱레인지나 BMW iX3 같은 고가 모델은 절반만 받는 구조입니다.
국비 기준 최대 지급액은 차종에 따라 승용 기준 최대 580만 원 수준이고, 여기에 지자체 보조금이 더해지면 서울시 기준 약 250만~350만 원이 추가됩니다. 반면 경상남도나 전라남도 같은 지방은 최대 900만 원까지 지자체 보조금이 나오는 곳도 있어요. 이 차이가 실제로 수백만 원이 갈립니다.
국비 vs 지자체 보조금 — 실수령액 현실 계산법
많은 분들이 착각하는 게 있어요. “보조금 = 국비” 라고 생각하는 건데, 실제로는 국비 + 지자체 보조금이 합산되어 출고가에서 차감되는 구조입니다. 다만 이 두 가지가 신청 시스템도 다르고, 예산 소진 시점도 다릅니다.
예시를 들어볼게요. 현대 아이오닉5 롱레인지(5,298만 원 기준)를 서울에서 구매한다면:
국비: 약 420만 원
서울시 보조금: 약 270만 원
합계: 약 690만 원 차감
실구매가: 약 4,608만 원
반면 동일 차량을 전라남도 나주에서 구매하면:
국비: 약 420만 원
전남 나주시 보조금: 약 850만 원
합계: 약 1,270만 원 차감
실구매가: 약 4,028만 원
같은 차인데 580만 원 차이가 납니다. 물론 실제 거주지 기준이니 아무 지역이나 선택할 순 없지만, 이사를 앞두고 있다면 이 차이를 절대 무시하면 안 됩니다.
차종별·지역별 보조금 비교표
차종
차량가격
국비(최대)
서울
경기
전남(나주)
합산 최대
현대 아이오닉5 롱레인지
5,298만원
420만원
270만원
330만원
850만원
최대 1,270만원
기아 EV6 스탠다드
4,799만원
460만원
270만원
330만원
850만원
최대 1,310만원
테슬라 모델Y RWD
5,699만원
210만원(50%)
135만원
165만원
425만원
최대 635만원
벤츠 EQA 250
6,150만원
0원(기준초과)
0원
0원
0원
0원
KG 모빌리티 토레스 EVX
4,290만원
480만원
270만원
330만원
850만원
최대 1,330만원
※ 위 수치는 2026년 상반기 기준 예시이며, 실제 지급액은 지자체 예산 및 차량 제원에 따라 달라질 수 있습니다. 무공해차 통합누리집(ev.or.kr) 기준 참조.
국내외 사례로 보는 보조금 신청 전략
환경부 산하 무공해차 통합누리집(ev.or.kr)은 차종별 보조금 조회, 지자체별 잔여 예산 확인, 신청 접수까지 한 번에 할 수 있는 공식 플랫폼입니다. 여기서 꼭 확인해야 할 게 ‘잔여 물량’인데, 매년 상반기(3~5월)에 예산이 폭발적으로 소진돼요. 2025년 서울시의 경우 5월 초에 이미 연간 예산의 70%가 소진됐습니다.
해외 사례를 보면 미국의 IRA(인플레이션 감축법)는 차량 최종 조립 위치까지 보조금 기준에 포함시켜 한국산 전기차가 불이익을 받는 구조가 있는데, 역설적으로 이게 국내 소비자에게는 기회가 됩니다. 현대·기아가 국내 판매 물량에 더 공격적인 할인·혜택을 제공하는 경향이 있거든요. 2026년 현재 현대차의 경우 딜러 할인 없이도 보조금 외 무이자 36개월 또는 취등록세 감면(최대 140만 원) 혜택을 병행 제공 중입니다.
또한 법인 구매 시에는 추가로 개별소비세 300만 원 한도 감면과 부가세 환급이 가능하기 때문에, 1인 법인이나 사업자를 보유한 분이라면 개인보다 훨씬 유리한 조건으로 살 수 있습니다. 이 부분은 세무사 상담을 강력히 권합니다.
보조금 날리는 5가지 흔한 실수 — 절대 하지 마세요
① 계약 전 지자체 보조금 잔여 물량 미확인: 계약서 쓰고 출고 기다리다가 보조금 소진되면 국비만 받거나 아예 못 받을 수 있어요. ev.or.kr에서 반드시 잔여 물량 먼저 확인하세요.
② 거주지 변경 타이밍 무시: 보조금은 ‘출고일 기준 거주지’가 아닌 ‘신청일 기준 주민등록 주소’ 지자체에서 받습니다. 이사 예정이라면 타이밍을 조율하세요.
③ 의무 운행 기간 조건 미확인: 보조금을 받으면 최소 2년 의무 운행 기간이 있어요. 이 기간 내 매도 시 보조금 일부 또는 전액 반환 의무가 생깁니다. 단기 보유 계획이라면 애초에 보조금 없는 차를 사는 게 나을 수도 있어요.
④ 출고 지연으로 인한 보조금 연도 교체: 12월에 계약했는데 출고가 다음 해 1월로 넘어가면 그해 보조금 기준이 새로 적용됩니다. 보조금이 줄어드는 방향이면 치명적이에요.
⑤ 중고 전기차 보조금 오해: 개인 간 거래로 중고 전기차를 사면 보조금이 없습니다. 보조금은 신차 최초 출고 시에만 적용됩니다. 일부 딜러가 이걸 애매하게 설명하는 경우가 있으니 주의하세요.
구매 전 반드시 확인할 체크리스트
☑ ev.or.kr에서 내 지자체 보조금 잔여 물량 확인 (실시간 업데이트됨)
☑ 차량 가격이 5,700만 원 이하인지 확인 (100% 지급 기준)
☑ 출고 예정일과 보조금 신청 마감일 교차 확인
☑ 취등록세 감면 한도(최대 140만 원) 및 개소세 감면 중복 적용 여부
☑ 2년 의무 운행 기간 수용 가능 여부
☑ 충전 환경(자택 충전기 설치 가능 여부, 입주 아파트 충전기 현황)
☑ 계약서에 ‘보조금 미지급 시 계약 해지 조항’ 포함 여부 확인
FAQ
Q1. 지자체 보조금을 이미 한 번 받았는데, 차를 바꾸면 또 받을 수 있나요?
네, 받을 수 있습니다. 단, 이전에 받은 보조금 차량의 의무 운행 기간(2년)이 경과해야 합니다. 2년 이내에 처분한 경우 보조금을 반환한 이력이 있어야 재신청 자격이 생깁니다. 반환 이력 없이 재신청하면 부정수급으로 처리될 수 있어요.
Q2. 수입 전기차는 보조금이 무조건 적게 나오나요?
가격 기준에만 걸리지 않으면 국산차와 동일하게 받을 수 있어요. 다만 수입 전기차 중 고가 모델(8,500만 원 초과)은 보조금 자체가 없습니다. 테슬라 모델3나 볼보 EX30 같은 가격이 낮은 수입 전기차는 보조금을 충분히 받을 수 있습니다. 단, 국산차 대비 배터리 인증 기준(배터리 안전·성능 인증) 통과 여부를 ev.or.kr에서 반드시 교차 확인하세요.
Q3. 보조금 신청을 딜러가 대신 해준다고 하는데, 직접 해야 하나요?
실무적으로 딜러가 대행해주는 경우가 많고, 이건 합법적인 과정입니다. 다만 신청자 본인의 서명과 주민등록증 사본이 필요하기 때문에 서류를 딜러에게 넘기기 전에 ev.or.kr에서 본인이 직접 잔여 물량과 지급 요건을 한 번 더 확인하는 걸 강력히 권합니다. “딜러가 알아서 해줄 거야”는 수백만 원짜리 믿음이 될 수도 있거든요.
한 줄 평: 전기차는 차 자체보다 ‘보조금 타이밍’이 실구매가를 결정합니다. 같은 차를 1,000만 원 이상 싸게 살 수도, 비싸게 살 수도 있어요. 정보가 곧 돈이라는 말이 이만큼 딱 맞는 케이스도 없습니다. ⭐⭐⭐⭐☆ (4/5 — 제도 자체는 훌륭하지만 복잡함은 여전히 단점)
이 글이 도움됐다면, 전기차 계약 앞둔 지인에게 공유해주세요. 한 명이라도 보조금 날리는 걸 막을 수 있다면 그걸로 충분합니다.
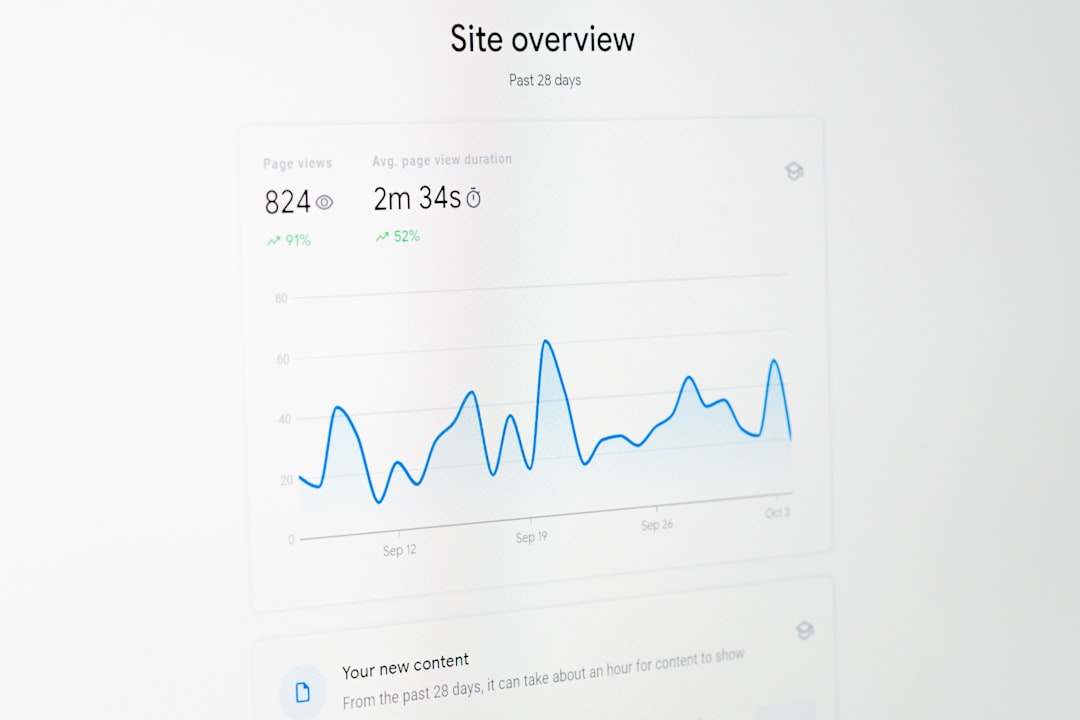
A friend of mine — a pretty sharp content marketer — told me recently that she’d spent three full weeks grinding out “perfectly optimized” blog posts, only to watch them flatline in Google Search Console. Zero impressions. She was following the same keyword research playbook she’d used for years. The problem? The game had quietly shifted underneath her, and nobody sent the memo.
That conversation stuck with me, because honestly? I’ve been there too. And if you’re reading this wondering why your content isn’t pulling traffic despite all the effort you’re putting in, let’s dig into what’s actually happening with keyword research right now — and what a smarter workflow looks like in 2025.
The Old Playbook Is Showing Its Age
For years, keyword research meant: open a tool (Ahrefs, SEMrush, Google Keyword Planner), sort by search volume, pick something with decent volume and low difficulty, write a 1,500-word post, done. Rinse, repeat.
Here’s what’s changed. Google’s Search Generative Experience (SGE) and AI Overviews now intercept a significant chunk of informational queries directly in the SERP. According to data from SparkToro and Datos.ai published in early 2025, roughly 58–65% of Google searches now result in zero clicks — meaning the user got what they needed from the results page itself without visiting any website.
That number isn’t just a stat to gloss over. It fundamentally changes which keywords are worth chasing. High-volume, simple informational queries (think: “what is compound interest”) are increasingly getting swallowed by AI snippets. The keywords that still drive real clicks? They tend to be:
Comparison and versus queries — “Ahrefs vs Semrush for small blogs 2025” (users want a human opinion, not a summary)
Experience-based searches — “does X actually work” or “honest review of Y”
Local + niche specifics — queries where generic AI answers fall flat because context matters deeply
Long-tail transactional intent — “best budget mechanical keyboard under $80 for programming”
Navigational queries tied to specific communities — Reddit threads, forums, specific brand ecosystems
What Actually Works in 2025: Intent Clustering Over Volume Chasing
The shift I’d recommend — and the one my friend eventually made — is moving from keyword-first thinking to intent cluster thinking. Here’s the practical difference:
Old way: Find keyword → write post → hope for ranking. New way: Identify a genuine user problem → map 8–15 related search intents around it → build a content cluster that satisfies the full journey.
Tools like Ahrefs’ “Topics” feature, Semrush’s Keyword Magic Tool grouped by intent, and newer AI-assisted tools like Surfer SEO’s Topical Map now make this clustering approach accessible without needing an enterprise SEO budget. Surfer, for instance, runs around $89–$219/month depending on tier in 2025, but there are solid free entry points via tools like Google Search Console’s Performance report (seriously underused) combined with AnswerThePublic’s free tier.
The SERP Feature Audit — Don’t Skip This Step
Before you commit to targeting any keyword, run a quick SERP feature audit. Paste your target keyword into Google and note:
Is there an AI Overview box at the top? (If yes, informational intent is likely captured — reconsider unless your angle is strongly experiential)
Are there shopping ads or product carousels? (Signals commercial intent — your content needs a transactional hook)
Do People Also Ask boxes dominate? (Gold mine for FAQ-style supporting content)
Are Reddit or Quora threads ranking page one? (This signals Google trusts community experience — lean into first-person narrative)
Are the top-ranking pages from 2023 or older? (Freshness gap = opportunity in 2025)
This five-minute audit saves hours of wasted writing. I can’t overstate how often people skip it.
Real-World Case: From 0 to 12K Monthly Visits in 6 Months
A SaaS content team I’ve been following on LinkedIn documented their 2024–2025 pivot publicly. They ditched volume-heavy head terms entirely and focused exclusively on “job-to-be-done” queries — searches where someone is actively trying to accomplish a task, not just learn about a concept.
Their example: instead of targeting “project management software” (insane competition, heavily AI-summarized), they built a cluster around “how to set up client onboarding workflow in Notion” — specific, task-oriented, and not something an AI snippet can fully resolve without a step-by-step walkthrough.
Result: 12,400 organic monthly sessions within six months, with a 4.2-minute average time on page. The traffic was smaller in raw numbers than chasing head terms would theoretically yield, but the conversion rate to email signups was 3x their previous content average. That’s the real metric to care about.
Tools Worth Actually Using Right Now
Here’s a non-exhaustive shortlist of what’s genuinely useful in 2025’s keyword research stack — with honest notes on each:
Google Search Console (free) — Still the most underrated tool in the room. Filter by “queries” with impressions but low CTR — those are your quick-win optimization targets.
Ahrefs ($129+/month) — Best-in-class for backlink data and keyword difficulty scoring. Their “Traffic Share” feature for competitor analysis is genuinely excellent.
Semrush ($139+/month) — Stronger on local SEO and PPC keyword data. Keyword Magic Tool with intent filters is a real time-saver.
AlsoAsked.com (freemium) — Visualizes People Also Ask relationships. Great for building FAQ sections and understanding query hierarchies.
Perplexity AI (free/Pro) — Increasingly useful for quick topic research and understanding how AI models synthesize information about your niche — which indirectly tells you what AI Overviews will say.
The Mistake That Quietly Kills Content Performance
One pattern I see repeatedly: people research keywords beautifully, then write content that doesn’t actually match the dominant intent. Google’s algorithm in 2025 is extremely sensitive to intent mismatch. If a keyword’s top 10 results are all listicles and you write a long-form essay, you’ll struggle — not because your content is bad, but because the format signal doesn’t align.
Before writing, scroll through the top 5 results for your target keyword and note: are they listicles, how-tos, comparison posts, or opinion pieces? Match the dominant format first, then differentiate within it through depth, freshness, or first-person experience.
If your situation is purely informational blogging with a small budget, lean hard into Google Search Console + AlsoAsked for free, and prioritize experience-led content that AI can’t easily replicate. If you’re running a content operation at scale (10+ posts/month), investing in Ahrefs or Semrush’s intent clustering features pays for itself quickly in saved research hours.
Here’s the honest bottom line: keyword research in 2025 isn’t dead — it’s just grown up. The tools are better, the data is richer, but the shortcuts that used to work are increasingly taxed by AI interception and zero-click dynamics. The content that wins now is built around specific human experience, genuine task completion, and intent clarity. That’s not harder to do; it just requires thinking about the reader’s actual problem before opening a keyword tool. Start there, and the rest gets a lot cleaner.
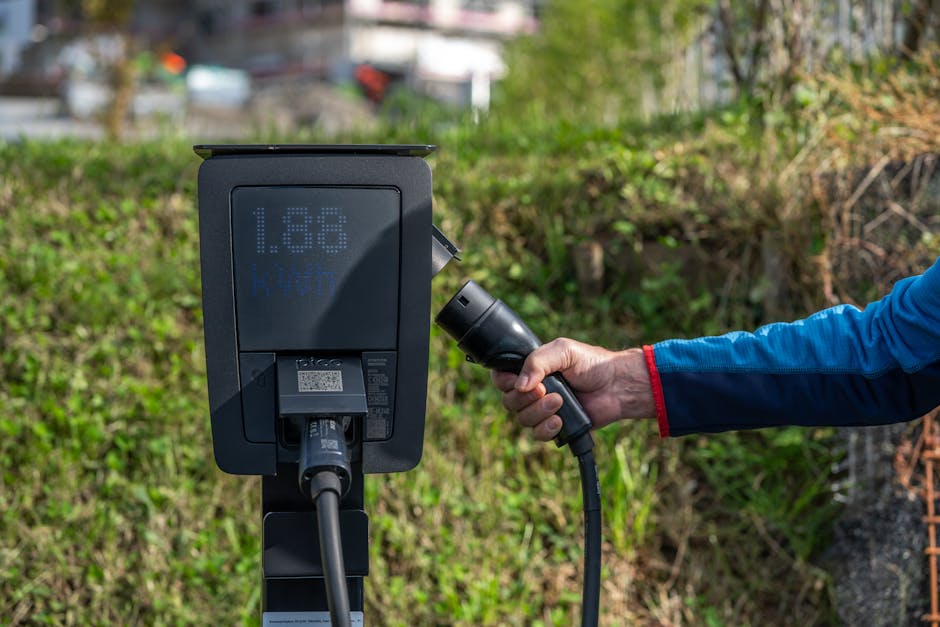
지인이 전기차 샀다고 자랑하길래 ‘유지비 얼마야?’라고 물어봤더니 ‘그냥 싸요~’라고 했다. 근데 3개월 뒤에 그 친구한테서 연락이 왔다. ‘야, 나 충전 요금 고속도로에서 기름값이랑 별 차이 없던데?’ 이게 많은 전기차 오너들이 겪는 현실이다. 산 다음에 알게 되는 것들. 이 글은 그 ‘산 다음에 알게 되는 것들’을 미리 알려주기 위해 쓴다.
📌 1. 전기차 충전 요금, 도대체 어떻게 책정되는 건가?
📌 2. 완속 vs 급속 vs 초급속 — 실제 비용 비교표
📌 3. 2026년 기준 주요 충전 사업자 요금 비교
📌 4. 충전비 아끼는 현실적인 방법 TOP 5
📌 5. 절대 하지 말아야 할 충전 실수 5가지
📌 6. FAQ — 독자들이 가장 많이 묻는 것들
1. 전기차 충전 요금, 도대체 어떻게 책정되는 건가?
전기차 충전 요금은 크게 두 가지 구조로 나뉜다. kWh당 단가와 충전 시간 기반 과금. 대부분의 국내 충전 사업자는 kWh당 단가 방식을 쓰지만, 일부 초급속 충전기(350kW급)는 시간 기반 과금도 병행한다.
2026년 현재 한국전력 주택용 전기 요금 기준으로 가정 완속 충전 시 저압 3단계 누진제 적용 시 kWh당 최대 약 307원까지 치솟을 수 있다. 반면 한전 전기차 충전 전용 요금제(저압 경부하 시간대)를 별도 계약하면 kWh당 약 57~88원대로 떨어진다. 이 차이를 모르고 일반 가정용 콘센트에 꽂아두면? 100kWh 배터리 기준으로 한 번 충전에 3만 원이 넘는 경우도 생긴다.
공공 충전기는 또 다르다. 환경부 통합 충전 네트워크(EV Infra 기준) 급속 충전기는 2026년 기준 kWh당 324.4원(회원가)이 기본이고, 비회원은 최대 400원대까지 올라간다. 여기다 고속도로 휴게소 민간 사업자 충전기는 kWh당 450~600원을 넘기는 곳도 수두룩하다. 이걸 모르고 급속 충전만 쓰다간 진짜 기름값이랑 별 차이 없어진다.
2. 완속 vs 급속 vs 초급속 — 실제 비용 비교표
숫자로 한번 정리해보자. 아래는 2026년 기준 대표적인 충전 방식별 실비용 비교다. 기준 차량은 배터리 용량 77kWh, 실제 사용 가능 용량 73kWh(현대 아이오닉 6 롱레인지 기준)로 계산했다.
충전 방식
출력
kWh당 단가(회원)
73kWh 완충 비용
완충 소요 시간
비고
가정용 완속 (일반 요금)
7kW
약 120~307원
약 8,760~22,411원
약 10~12시간
누진제 구간에 따라 큰 차이
가정용 완속 (EV 전용 요금제)
7kW
약 57~88원
약 4,161~6,424원
약 10~12시간
한전 전기차 요금제 별도 계약 필수
공공 완속 (환경부)
7kW
약 255원
약 18,615원
약 10~12시간
회원카드 필요
공공 급속 (환경부)
50kW
약 324.4원
약 23,681원
약 1.5시간
가장 보편적인 공공 급속
민간 초급속 (휴게소 등)
100~350kW
약 450~620원
약 32,850~45,260원
약 20~40분
고속도로 민간 사업자 최대 요금
테슬라 수퍼차저 (비테슬라)
최대 250kW
약 500~550원
약 36,500~40,150원
약 25~35분
2026년 타사 차량 개방 이후 요금
보이는가? 가정용 EV 전용 요금제 심야 충전과 고속도로 민간 초급속 충전의 비용 차이가 최대 10배에 달한다. 이게 현실이다.
3. 2026년 기준 주요 충전 사업자 요금 비교
국내 충전 인프라는 2026년 현재 크게 환경부(EV 충전 서비스), SK시그넷/SK일렉링크, GS칼텍스(에너지플러스), 현대차(이피트, E-pit), 차지비(롯데), 테슬라 수퍼차저로 나뉜다. 사업자마다 요금 체계, 회원제 혜택, 로밍 여부가 다르기 때문에 본인 차량과 동선에 맞는 사업자를 ‘전략적으로’ 골라야 한다.
사업자
급속(kWh당)
완속(kWh당)
월정액/연회비
특징
환경부 충전 서비스
324.4원
255원
없음
전국망, 로밍 광범위, 앱 필수
SK일렉링크
약 340~390원
약 260원
일부 플랜 있음
고속도로 거점 강점
GS에너지플러스
약 350원
약 265원
없음
GS25 편의점 연계 충전
현대 E-pit
약 390~420원(초급속)
해당 없음
없음
350kW 초급속, 현대·기아 차량 최적화
차지비(롯데)
약 330원
약 255원
없음
롯데마트/백화점 연계
테슬라 수퍼차저
약 500~550원
해당 없음
없음(비테슬라)
속도 빠르나 요금 높음
솔직히 말하면, 환경부 충전 서비스 앱 하나는 무조건 깔아야 한다. 전국 커버리지와 로밍 면에서 아직도 최강이고, 요금도 민간 사업자 대비 저렴한 편이다. 다만 앱 UI가 불편하다는 건 2026년에도 변함없는 단점이다.
4. 충전비 아끼는 현실적인 방법 TOP 5
숫자를 봤으면 이제 전략을 짜야 한다. 아래는 실제로 연간 충전 비용을 30~50% 절감할 수 있는 방법들이다. 이론이 아니라 진짜 쓰는 방법들이다.
한전 전기차 전용 요금제 계약 + 심야 충전 고정 루틴화 아파트 세대용 완속 충전기 또는 단독주택 홈 충전기가 있다면 한전 전기차 전용 요금제(사업용 저압 또는 주택용 전기차 충전 요금)를 별도로 신청해야 한다. 경부하 시간대(23:00~09:00) 기준 kWh당 57~88원은 공공 급속 대비 최대 5~6배 저렴하다. 연간 2만 km 주행 기준 연료비 절감액 최대 약 80~120만 원.
카드사 EV 충전 할인 카드 적극 활용 현대카드, 신한카드, KB국민카드 등 주요 카드사에서 EV 충전 특화 상품을 운영 중이다. 월 할인 한도가 있지만 공공 급속 충전 기준 월 3~5만 원 절감이 가능하다.
충전 로밍 앱 복수 가입 (환경부 + 1개) 메인 앱은 환경부, 서브 앱은 본인 이동 동선에 많은 사업자(GS에너지플러스 또는 차지비)로 설정하면 요금이 저렴한 충전기를 골라 쓸 수 있다.
쇼핑몰·마트 무료/할인 완속 충전 적극 이용 이케아, 코스트코, 스타필드, 롯데마트 등에서 운영하는 완속 충전기는 2~3시간 쇼핑하면서 공짜 또는 파격 할인가에 충전 가능하다. 주말 쇼핑 루틴과 연계하면 월 2~4만 원 절감.
계절별 배터리 관리로 kWh당 실효율 높이기 전기차 배터리는 겨울철 저온에서 실제 주행 가능 거리가 30~40% 감소한다. 프리컨디셔닝(출발 전 배터리 예열) 기능을 쓰면 동절기 충전 효율을 15~20% 개선할 수 있다.
5. 절대 하지 말아야 할 충전 실수 5가지
❌ 일반 가정용 콘센트(220V, 16A)에 무한정 꽂아두기 — 전용 회로 없이 쓰면 과부하로 차단기 트립은 기본, 화재 위험도 있다. 반드시 전기차 전용 회로(32A 이상)를 별도 설치할 것.
❌ 배터리 100% 완충 상태로 장기 주차 — 리튬이온 배터리는 100% 충전 상태에서 열화가 가속된다. 일상 주행은 80%, 장거리 전날에만 100% 충전하는 게 배터리 수명에 좋다.
❌ 고속도로 초급속만 반복 이용 — 급속 충전 빈도가 높을수록 배터리 수명에 부담을 준다. 실제로 급속 충전 비율이 전체의 70% 이상이면 5년 후 배터리 용량 저하가 더 빠르게 진행된다는 데이터가 있다.
❌ 배터리 0%까지 방전 후 충전 반복 — 완방전은 배터리 셀에 돌이킬 수 없는 손상을 줄 수 있다. 10~20% 이상 유지하는 습관을 들여야 한다.
❌ 충전 요금 확인 없이 민간 비회원 충전기 사용 — 비회원 요금이 회원 요금 대비 최대 30~50% 비싸다. 5분 걸리는 앱 가입이 충전할 때마다 1,000~3,000원을 아껴준다.
FAQ
Q1. 아파트에 사는데 집에서 충전할 수 있나요? 관리비 포함인가요?
가능하다. 다만 아파트마다 다르다. 입주자 대표회의를 통해 전기차 충전 설비를 신청해야 하고, 한전에 전기차 충전 전용 회로를 신청하면 별도 계량기로 측정된다. 관리비에 합산되지 않고 한전에 직접 납부하는 구조가 일반적이다. 최근에는 ‘공동주택 전기차 충전 서비스 사업자(환경부 인증)’가 무료로 충전기를 설치해주고 kWh당 사용료를 받는 모델도 많아졌으니 관리사무소에 먼저 문의해보는 게 빠르다.
Q2. 충전 카드가 너무 많아요. 어떤 것 하나만 써도 되나요?
하나만 쓰려면 환경부 충전 서비스(EV Infra 앱 또는 충전 카드)를 추천한다. 전국 로밍 범위가 가장 넓고, 대부분의 공공 충전기가 환경부 네트워크에 연결돼 있다. 다만 사업자별로 할인 이벤트나 카드 혜택이 있기 때문에 장기적으로는 2개 앱 정도는 갖고 다니는 게 유리하다.
Q3. 전기차 충전 요금이 앞으로 계속 오를까요? 지금 사도 괜찮은가요?
솔직히 말하면 오를 가능성이 높다. 2022~2023년 한전 적자로 전기 요금이 인상됐고, 전기차 보급 확대로 충전 인프라 유지 비용도 늘어나고 있다. 하지만 2026년 현재도 심야 가정 충전 기준으로는 내연기관 유류비 대비 1/3~1/4 수준이다. 충전 전략만 잘 짜면 여전히 유리하다. 다만 ‘무조건 싸다’는 환상은 버리고, 본인의 충전 환경(아파트 여부, 주행 거리, 충전 패턴)을 먼저 따져보고 결정하는 게 맞다.
결론
전기차 충전 요금은 ‘싸다’도 ‘비싸다’도 아니다. 전략에 따라 연간 수십만 원이 갈리는 관리 항목이다. 가정 충전 환경 + 한전 전용 요금제 + EV 충전 할인 카드 이 세 가지만 제대로 세팅해도 공공 급속 충전만 쓰는 것보다 연간 80만 원 이상 차이가 난다. 반대로 아무 생각 없이 고속도로 급속 충전기만 쓰면 기름값 내는 거랑 진짜로 별 차이 없어진다.
한 줄 평: 전기차는 ‘사는 순간’이 아니라 ‘충전 루틴을 세팅하는 순간’이 진짜 비용이 결정된다.
아는 동생이 말해주는 것처럼: 전기차 계약하기 전에 아파트 충전 가능 여부랑 한전 전기차 요금제 신청 가능 여부부터 확인해. 이거 두 개 안 되면 충전 전략 짜기가 훨씬 복잡해지거든. 미리 알면 후회 없다.
A friend of mine spent nearly two weeks troubleshooting dropped calls and sluggish data on her Verizon plan before she finally called me in frustration. “I’m paying for premium coverage,” she said, “and I can’t even load a webpage in my apartment.” That conversation sent me down a rabbit hole of Verizon’s current network architecture, plan structures, and real-world performance data — and honestly, what I found surprised me in both good and bad ways.
So let’s dig into what’s actually going on with Verizon in 2025, where it genuinely delivers, and where you might want to reconsider your options.
The Coverage Promise vs. The Reality on the Ground
Verizon has aggressively marketed its C-Band 5G rollout, and the numbers on paper are impressive: the carrier claims coverage reaching over 200 million people with its mid-band 5G spectrum. In T-Mobile vs. Verizon benchmark tests published by Opensignal and Ookla in early 2025, Verizon’s median 5G download speed clocked in around 187 Mbps in dense urban environments — competitive, but not dominant.
Here’s where it gets tricky. Verizon’s 5G Ultra Wideband (mmWave) is genuinely blazing — we’re talking peak speeds of 1.5–4 Gbps in ideal conditions — but mmWave signal doesn’t penetrate walls or travel more than a few hundred feet. If you’re standing inside a concrete-and-glass office building three blocks from a mmWave node, you’re essentially back on LTE. That was exactly my friend’s apartment problem: technically “covered,” practically throttled.
The C-Band mid-band layer is more realistic for everyday use. Latency typically runs 18–28ms in tested urban zones, which is solid for video calls and gaming but not the near-zero latency Verizon’s marketing implies.
Breaking Down the 2025 Plan Structure — Where Hidden Costs Live
Verizon restructured its consumer plans in late 2024, and those changes are fully in effect now. Here’s a quick breakdown of the current tiers:
Unlimited Welcome: Entry-level at ~$65/month for one line. Deprioritized data after network congestion kicks in — no hard cap, but real-world speeds can drop below 10 Mbps during peak hours in busy areas.
Unlimited Plus: ~$80/month. Includes 30GB of premium data before deprioritization, plus 15GB of mobile hotspot at full 5G speeds. Better, but the hotspot cap hits fast if you WFH.
Unlimited Ultimate: ~$90/month. 60GB premium data, 60GB hotspot, and access to Apple One or similar bundled perks. This is where Verizon’s value proposition actually holds up — if you use those add-ons.
myPlan add-ons: Verizon’s à la carte model allows you to bolt on services like Disney+, Apple One, or international roaming for $10/month each. Sounds flexible, but it’s easy to stack $30–40/month in add-ons without noticing.
The hidden cost trap? Taxes and fees. Depending on your state, you can add $8–18/month per line on top of advertised prices. A “$65” plan in a high-tax state like New York or California can realistically land at $82–83 out of pocket.
Real-World Performance: What Third-Party Data Says in 2025
Rather than taking carrier claims at face value, let’s look at what independent sources are reporting:
Ookla Speedtest Q1 2025: Verizon ranked second in overall 5G median download speed nationally, behind T-Mobile’s 220 Mbps median but ahead of AT&T’s 164 Mbps.
RootMetrics H1 2025: Verizon took the top spot in reliability across 125 U.S. markets — its strongest differentiator. Fewer dropped calls and more consistent LTE fallback compared to competitors.
J.D. Power 2025 Wireless Survey: Verizon scored highest among customers who travel frequently for business, particularly in rural interstate corridors — its legacy CDMA and LTE infrastructure still showing advantages there.
Tutela/Opensignal Consistent Quality Score: Verizon scored 82.4% vs. T-Mobile’s 79.1%, meaning Verizon users experience fewer “bad” sessions even if peak speeds aren’t always class-leading.
The pattern here is clear: Verizon wins on consistency and reliability, not raw speed. If you’re someone who needs predictable performance rather than occasional blazing fast downloads, that matters enormously.
When Verizon Actually Makes Sense — And When It Doesn’t
Let me be direct here, because this is where most Verizon reviews go vague.
Verizon is a strong choice if:
You live or work in a suburban or rural area where T-Mobile’s mid-band coverage is still spotty
You travel frequently across U.S. interstates and national parks (Verizon’s rural LTE footprint remains best-in-class)
You’re on a corporate or government account — Verizon’s enterprise SLA agreements are genuinely superior
You’re bundling multiple lines for a family and using the Unlimited Ultimate plan’s perks fully
Verizon is hard to justify if:
You’re a solo user primarily in a major metro like Chicago or LA, where T-Mobile’s 5G is both faster and cheaper
You need heavy hotspot usage — Visible (a Verizon MVNO) actually offers unlimited hotspot on the same network at ~$45/month
You’re on a tight budget — MVNOs like Visible, Straight Talk, or Total Wireless run on Verizon’s network at 40–50% lower cost, though with deprioritized data
The MVNO Backdoor Most People Overlook
Here’s something worth knowing: Verizon operates or licenses its network to several MVNOs that offer substantially lower prices. Visible (owned by Verizon) offers a $45/month unlimited plan on the exact same 5G network. The trade-off is that Visible customers are deprioritized during congestion — but in practice, for most users in low-to-medium traffic areas, the speed difference is negligible.
Consumer Reports and The Verge have both highlighted this in 2025 coverage comparisons. If your priority is “Verizon network quality at a discount,” the MVNO route is a legitimate strategy, not a compromise.
Fixing Indoor Coverage Problems (The Actual Solution)
Back to my friend’s apartment issue — here’s what actually worked. Verizon offers the Network Extender device (~$199 one-time) that creates a femtocell using your home broadband connection. It solved her problem completely. Alternatively, if you have Wi-Fi calling enabled on your device (Settings → Phone → Wi-Fi Calling on iOS; Settings → Connections → Wi-Fi Calling on Android), Verizon will route calls over your home internet transparently. This is free and often overlooked.
For persistent weak signal in specific rooms, check that your device’s 5G mode isn’t locked to mmWave only — on iPhone, go to Settings → Cellular → Cellular Data Options → Voice & Data and set it to “5G Auto” rather than “5G On.” The “5G On” setting forces the phone to seek 5G even when LTE would give better penetration, which is counterintuitive but true.
Bottom line from someone who’s been through this: Verizon isn’t the automatic best choice it once was, but it’s still the right choice for specific situations — and knowing those situations is worth more than any blanket recommendation. If you’re on the fence, run your actual address through Verizon’s coverage map and cross-reference it with T-Mobile’s, then factor in whether you travel frequently. That 10-minute exercise will tell you more than any spec sheet.
얼마 전 초등학교 3학년 아이를 둔 친구한테 연락이 왔어요. “야, 우리 애가 연산은 빠른데 문장제 문제만 나오면 멍 때린다. 왜 그럴까?” 저도 딱 그 나이에 비슷한 경험이 있어서 바로 알아들었습니다. 연산 속도랑 수학적 사고력은 완전히 다른 근육이거든요. 그리고 이게 초등 3~4학년을 기점으로 격차가 벌어지기 시작하는데, 이 시기를 놓치면 중학교 가서 아무리 돈 쏟아부어도 ‘기초 체력’이 없어서 복구가 정말 힘들어요. 오늘은 2026년 현재 교육 현장에서 실제로 검증된 수학 사고력 키우는 법, 그리고 부모들이 흔히 저지르는 실수까지 싹 정리해드릴게요.
🧠 수학 사고력이란 정확히 무엇인가? — 연산과의 결정적 차이
📊 골든타임 분석 — 나이별 사고력 발달 데이터
🔬 2026년 검증된 사고력 수학 프로그램 비교표
📚 국내외 사례 — 핀란드·싱가포르는 어떻게 가르치나
❌ 절대 하지 말아야 할 실수 — 부모의 흔한 오해 체크리스트
❓ FAQ — 독자들이 가장 많이 묻는 질문 3가지
✅ 결론 및 한 줄 평
🧠 수학 사고력이란 정확히 무엇인가? — 연산과의 결정적 차이
많은 부모님들이 구구단 빠르게 외우고, 받아올림 잘하면 “수학 잘한다”고 착각합니다. 솔직히 말하면 그건 계산기가 더 잘합니다. 수학 사고력은 문제 상황을 구조화하고, 패턴을 찾고, 논리적 순서로 해결책을 도출하는 능력이에요.
구체적으로 나누면 이렇습니다:
수 감각(Number Sense): 37 + 48을 계산할 때 “35 + 50 = 85″로 재구성하는 유연성
공간 추론(Spatial Reasoning): 도형의 회전, 전개도 상상, 좌표 감각
논리적 추론(Logical Reasoning): ‘참이면 A, 거짓이면 B’ 조건 처리
대수적 사고(Algebraic Thinking): □ + 5 = 12 형태의 미지수 개념 — 중학 대수의 뿌리
미국 NCTM(전국수학교사협의회) 2023년 보고서에 따르면, 초등 4학년 때 대수적 사고 능력이 상위 25%에 속한 학생은 고등학교 수학 성취도에서 하위 25% 학생 대비 평균 2.3배 높은 점수를 기록했습니다. 단순 연산 능력은 이 격차를 예측하지 못했어요.
📊 골든타임 분석 — 나이별 사고력 발달 데이터
뇌과학 관점에서 수학적 사고와 가장 밀접한 전두엽 기능은 만 6세~10세 사이에 가장 가파른 발달 곡선을 그립니다. 이 시기에 구조화된 자극을 받지 못하면 시냅스 가지치기(Synaptic Pruning) 과정에서 해당 회로가 정리돼버려요. 쉽게 말해, “쓰지 않으면 뇌가 버린다”는 겁니다.
국내 교육부 기초학력 진단 데이터(2024년 기준, 전국 초등 6학년 약 43만 명 대상)를 보면:
연산 기초 미달: 8.4%
문제해결(사고력) 영역 미달: 21.7%
두 영역 모두 미달: 5.2%
연산은 괜찮은데 사고력이 부족한 학생이 전체의 약 16%라는 뜻입니다. 100명 중 16명이요. 그리고 이 아이들 대부분은 중학교 1학년 방정식 단원에서 처음 ‘벽’을 만나게 됩니다.
🔬 2026년 검증된 사고력 수학 프로그램 비교표
시중에 넘쳐나는 프로그램을 직접 체험해보거나 현장 교사 인터뷰를 통해 정리했습니다. 비용은 2026년 상반기 기준 월 평균 수강료입니다.
프로그램명
대상 연령
핵심 방법론
월 비용(원)
강점
약점
추천 대상
CMA 사고력수학
5세~초3
조작 교구 + 스토리텔링
18만~25만
추상 개념을 손으로 체험
진도 느림, 부모 관여 필요
취학 전·저학년 첫 수학
시매쓰
초1~초6
영재원 커리큘럼 기반
22만~35만
경시대회 준비 병행 가능
난이도 편차 큼, 좌절 주의
이미 기초가 탄탄한 아이
매쓰플랫(MathFlat)
초1~중3
AI 적응형 문제 추천
3만~9만(온라인)
개인 약점 집중 공략
화면 집중 피로, 오프라인 없음
자기주도 학습 가능한 초4 이상
싱가포르 수학 교재(직수입)
초1~초6
Bar Model(막대모델) 시각화
2만~4만(교재 자습)
가성비 최강, 구조적 사고 직관
한국어 해설 부족, 부모 학습 필요
비용 절감 원하는 적극적 부모
영재사관학교 소마
5세~초6
블록·퍼즐 기반 수학적 놀이
20만~30만
수학 흥미 유발 탁월
학교 진도 연계 약함
수학 거부감 있는 아이 진입용
한 줄 요약: 아이가 수학을 싫어하면 소마·CMA로 흥미 먼저, 기초가 갖춰졌으면 싱가포르 Bar Model로 사고 구조 잡고, 상위권 목표면 시매쓰 or 매쓰플랫 조합이 현재 가장 검증된 루트입니다.
📚 국내외 사례 — 핀란드·싱가포르는 어떻게 가르치나
2026년 PISA(국제학업성취도평가) 최신 트렌드를 보면 수학 최상위권 국가들의 공통점이 있습니다.
싱가포르: Bar Model의 힘
싱가포르 초등 수학은 CPA(Concrete → Pictorial → Abstract) 3단계 접근법이 핵심입니다. 예를 들어 “사탕 36개를 4명이 나누면?”이라는 문제를 풀 때, 직접 물건을 나눠보고(Concrete), 그림으로 막대를 그려보고(Pictorial), 그 다음에 36 ÷ 4 = 9라는 수식(Abstract)으로 올라갑니다. 우리나라처럼 처음부터 수식으로 들어가지 않아요. 싱가포르 교육부(MOE) 공식 자료에 따르면 이 방식으로 교육받은 학생의 문장제 문제 정답률이 전통 방식 대비 약 34% 높았습니다.
핀란드: ‘느린 수학’의 역설
핀란드는 초등 저학년 때 연산 속도를 강요하지 않습니다. 대신 “왜 이 답이 나왔는지 설명해봐”라는 메타인지 훈련에 집중합니다. 헬싱키 대학교 교육연구소 2022년 논문에 따르면, 이렇게 훈련된 학생들은 중학교 이후 복잡한 응용문제에서 오답률이 타국 대비 41% 낮았습니다.
국내 사례: 대치동 vs. 혁신교육
대치동 사고력 학원들이 경시대회 트랙으로만 달리는 것과 달리, 혁신학교 계열 수학 수업은 ‘프로젝트형 수학’을 도입하고 있어요. 예를 들어 “우리 교실 넓이를 자로 재서 타일이 몇 장 필요한지 계산해라”처럼 실생활 맥락을 붙이는 방식입니다. 실제로 경기도 혁신초등학교 3개교 대상 2023년 연구에서, 프로젝트형 수학 수업을 받은 반이 전통 수업 반보다 수학 흥미도 점수가 22점(100점 만점) 더 높았습니다.
❌ 절대 하지 말아야 할 실수 — 부모의 흔한 오해 체크리스트
이거 진짜 현장에서 많이 봤어요. 선의로 하는 행동인데 아이 사고력을 오히려 죽이는 케이스들입니다.
❌ “답 빨리 말해봐” 강요 — 속도 압박은 수 감각이 아니라 불안 반응을 키웁니다. 틀려도 “어떻게 생각했어?”로 과정을 먼저 물어보세요.
❌ 선행 학습 과잉 — 초2인데 초5 문제집 풀리기. 개념 이해 없이 패턴 암기로 풀면 중학교에서 반드시 무너집니다. 선행은 한 학기 이내가 가장 효과적이라는 연구가 다수입니다.
❌ 틀린 문제를 바로 고쳐주기 — 아이가 스스로 오류를 인식하고 수정하는 과정이 메타인지의 핵심입니다. 답 체크는 최소 10분 뒤에 하세요.
❌ “수학은 원래 어려워” 발언 — 스탠퍼드 드웩 교수의 ‘성장형 마인드셋’ 연구에 따르면, 부모의 이런 발언이 아이의 수학 자기효능감을 평균 23% 낮춥니다.
❌ 학원 2~3곳 동시 등록 — 사고력 수학은 깊이가 핵심인데, 여러 기관의 다른 방법론을 동시에 주입하면 오히려 혼란을 줍니다. 한 곳에서 6개월 이상 집중하는 게 낫습니다.
❌ 초등 고학년까지 미루기 — “초4되면 시작하지 뭐”라는 생각이 가장 위험합니다. 앞서 말했듯 골든타임은 만 10세 전후가 피크예요. 지금 당장 시작하지 않을 이유가 없습니다.
❓ FAQ
Q1. 연산을 못하면 사고력 수학을 시작하기 어렵지 않나요?
꼭 그렇지 않습니다. 사고력 수학의 상당 부분은 공간 추론, 논리 퍼즐, 패턴 인식처럼 연산과 독립적입니다. 오히려 사고력 훈련을 먼저 받은 아이가 나중에 연산의 ‘왜’를 이해하면서 더 빠르게 연산 속도도 올라오는 경우가 많아요. 레고 맞추는 능력이랑 나사 조이는 속도는 다른 스킬입니다.
Q2. 사고력 수학 학원, 한 달에 20만~30만 원이 부담스러운데 대안이 있나요?
있습니다. 싱가포르 수학 교재(Primary Mathematics 시리즈)는 인터넷 서점에서 권당 1만 5천 원~2만 원 수준에 구입 가능하고, 유튜브에 ‘싱가포르 수학 bar model’ 검색하면 한국어 해설 영상도 꽤 있어요. 여기에 매쓰플랫(월 3~9만 원 AI 보조) 조합이면 학원의 60~70% 효과를 절반 이하 비용으로 낼 수 있습니다. 단, 부모의 30분 주 3회 동반 학습은 필수입니다.
Q3. 이미 초등 5학년인데 늦은 건 아닌가요?
늦었지만 포기할 상황은 아닙니다. 다만 접근 방식을 바꿔야 해요. 이 시기부터는 ‘사고력 기초’ 재설계보다 중학 대수 대비 ‘대수적 사고 집중 트레이닝’이 더 효율적입니다. 방정식 개념을 스토리 맥락으로 접근하는 교재(예: 『생각하는 초등수학 개념편』시리즈, 디딤돌)를 활용하거나, 매쓰플랫처럼 AI가 부족한 단원을 집중 처방해주는 도구를 쓰는 게 현실적입니다. 시작 안 하는 것보다 지금 당장 시작하는 게 100배 낫습니다.
✅ 결론 및 한 줄 평
수학 사고력은 IQ나 타고난 머리의 문제가 아닙니다. 구조화된 자극을 골든타임에 얼마나 받았느냐의 문제입니다. 연산 빠른 아이가 중학교 가서 무너지는 이유, 사교육을 많이 시켰는데도 수학을 싫어하는 이유가 여기 있어요. 2026년 기준 가장 검증된 루트는 취학 전~초3은 조작 교구 + 스토리텔링 → 초3~초5는 싱가포르 Bar Model + AI 보조 → 초5 이후는 대수적 사고 집중입니다. 방법은 다양하고 비용 차이도 크지만, 공통점은 하나입니다. 지금 시작해야 한다는 것.
한 줄 평: “연산은 계산기가 하고, 사고력은 아이가 한다 — 그 사고력은 지금 이 순간에 만들어진다.”
📌 마지막으로 한마디 드리자면: 이 글을 끝까지 읽으셨다면 이미 남들보다 한 발 앞선 부모입니다. 아는 것과 실행하는 것 사이의 거리를 좁히는 게 가장 어렵지만, 오늘 저녁 아이한테 “이 문제 어떻게 생각했어?” 딱 한 마디만 바꿔도 시작입니다. 파이팅입니다.
A friend of mine — sharp guy, works in finance, not easily fooled — called me last spring absolutely fuming. He’d spent over $4,000 on what the jeweler described as a ‘lab-created diamond with all the same properties as natural,’ only to find out later he’d paid a premium price for a stone that any reputable grading lab would have flagged as inconsistently certified. The paperwork looked right. The stone sparkled. But something was off, and it took a second opinion from a GIA-trained gemologist to unravel it.
That story stuck with me. Because lab grown diamonds — the real, legitimate ones — are genuinely one of the most fascinating shifts in the jewelry market right now. But the gap between a well-informed buyer and a confused one is enormous, and in 2025, that gap can cost you thousands.
So let’s dig in together.
What Actually Makes a Lab Grown Diamond a Diamond?
First, let’s get the science straight, because this matters more than most salespeople will admit. A lab grown diamond is not a simulant. It’s not cubic zirconia, it’s not moissanite. It is, chemically and physically, identical to a mined diamond — pure carbon arranged in a cubic crystal structure, with the same refractive index (2.417), the same hardness (10 on Mohs scale), and the same thermal conductivity.
There are two production methods, and knowing the difference will help you ask smarter questions:
HPHT (High Pressure High Temperature): Mimics the geological conditions deep in the Earth. A carbon source is subjected to pressures exceeding 1.5 million PSI and temperatures around 1,400–1,600°C. Tends to produce stones with a slight yellowish or bluish tint if not carefully controlled. Often used for smaller, industrial-grade stones, but high-quality gem HPHT exists.
CVD (Chemical Vapor Deposition): A hydrocarbon gas (usually methane) is introduced into a chamber with a diamond seed crystal. The carbon atoms precipitate layer by layer onto the seed. CVD produces larger, gem-quality stones more consistently and is currently the dominant method for jewelry-grade lab diamonds.
The important thing: a well-grown CVD or HPHT diamond cannot be told apart from a mined diamond by the naked eye. Not by your jeweler’s loupe either. It takes specialized equipment — a DiamondView machine or spectroscopy — to distinguish them.
The 2025 Price Landscape — And Why the Numbers Surprise People
Here’s where it gets really interesting, and frankly, a bit counterintuitive. In 2025, lab grown diamond prices have continued their steep descent that began around 2020–2021. We’re talking about a 1-carat, G color, VS1 clarity, excellent cut lab grown diamond retailing for roughly $800–$1,400 depending on the vendor — compared to $5,000–$7,000 for a comparable natural stone.
That’s a price gap of 75–85%. A few years ago it was closer to 50%. The gap is widening, not narrowing.
Why? Because production has scaled dramatically. Facilities in China now produce tens of millions of carats annually. The marginal cost of producing a 1-carat CVD diamond has dropped below $300 at scale. Meanwhile, natural diamond supply remains constrained — De Beers and Alrosa control significant portions of global supply, and new major mines are increasingly rare finds.
This creates a paradox for buyers: the resale value of lab grown diamonds has essentially collapsed. If you paid $2,000 for a 1-carat lab diamond two years ago, you might get $200–$400 for it today. Natural diamonds aren’t great investments either, but they’ve retained value comparatively. So the question isn’t just ‘which is better’ — it’s ‘what are you actually buying this for?’
Grading Reports — The Detail That Separates a Smart Buy from a Costly Mistake
This is where my friend got burned, and where a lot of buyers do. Not all grading reports are equal. Here’s what you need to know in 2025:
GIA (Gemological Institute of America): The gold standard. GIA now grades lab grown diamonds with the same 4C rigor as naturals. Look for their distinctive laser inscription on the girdle and a report number you can verify online at gia.edu.
IGI (International Gemological Institute): Has become very popular specifically for lab grown diamonds, especially from vendors like James Allen and Brilliant Earth. IGI grades are generally reliable, though some gemologists note IGI can grade slightly more generously than GIA on color and clarity.
GCAL (Gem Certification & Assurance Lab): Gaining traction, particularly because they include an ‘eye clean’ guarantee and light performance analysis — useful for buyers who care about brilliance over paperwork specs.
Avoid or scrutinize carefully: EGL (European Gemological Laboratory) reports, especially older ones, and any in-house certifications from the retailer itself. These are where inconsistencies appear most often.
Pro tip: Always cross-reference the report number on the certifying lab’s official website. A legitimate report will pull up instantly with matching specs. If it doesn’t, walk away.
Real-World Vendor Comparison — Who’s Actually Worth Your Money in 2025?
I’ve spent time reading through buyer reviews, gemologist assessments, and pricing comparisons across major platforms. Here’s a practical breakdown:
James Allen (jamesallen.com): Excellent 360° video previews for every stone — genuinely useful when buying online. Strong IGI-certified lab grown selection. Pricing is competitive, and their customer service has consistently ranked well in independent reviews. Good for mid-range buyers ($800–$3,000 range).
Brilliant Earth (brilliantearth.com): Positions itself as the ethical choice, and their supply chain transparency is above average. Prices run slightly higher than competitors, but they offer both IGI and GIA certified stones. They also have physical showrooms in major US cities, which matters if you want to see before you buy.
Whiteflash (whiteflash.com): If cut quality is your priority above all else, Whiteflash’s ‘A CUT ABOVE’ lab grown line is genuinely exceptional. Their light performance data is detailed and independently verified. Premium priced, but for engagement rings where brilliance matters most, the difference is visible.
Clean Origin (cleanorigin.com): Lab grown diamonds only, aggressive pricing, but stick to IGI-certified stones from their catalog. Their website UI isn’t the slickest, but value-per-carat is hard to beat for budget-conscious buyers.
The Question Nobody Asks: Is a Lab Diamond Right for Your Situation?
Let’s be honest about use cases here, because this is genuinely conditional advice:
If you want maximum size/visual impact for a fixed budget — lab grown is an obvious win. You can get a 2-carat VS1 for what a 0.8-carat natural would cost. The sparkle is identical to an untrained eye.
If you’re buying for long-term emotional value or heirloom potential — natural diamonds hold sentimental and cultural weight that many buyers still associate with rarity. Right or wrong, that perception exists.
If resale or investment is any part of your thinking — neither option is a great investment, but lab grown diamonds have almost no secondary market value in 2025. Do not factor resale into your lab diamond purchase decision at all.
If the environmental angle matters to you — this is nuanced. CVD diamond production is energy-intensive, though some producers (Ada Diamonds, for example) use 100% renewable energy. Ask specifically about energy sourcing, not just the ‘lab grown = eco-friendly’ marketing pitch.
Red Flags to Watch Before You Swipe Your Card
Based on aggregated buyer experiences and industry reports from 2025, here are the warning signs worth knowing:
No independent grading report, or a report from an unfamiliar/in-house lab
Pressure to ‘decide today’ or claims that pricing won’t last — a tactic more common in physical stores than reputable online vendors
Vague answers about whether a stone is HPHT or CVD treated (post-growth treatment to improve color exists and should be disclosed)
Missing laser inscription — reputable stones have the report number inscribed on the girdle, visible under 10x magnification
Prices dramatically below market rate without explanation — a 1-carat VS1 G lab diamond for $300 is not a deal, it’s a flag
What I’d Actually Do With a $2,000 Budget in 2025
Purely practical scenario: $2,000 for an engagement ring center stone. In 2025, that budget gives you genuinely different options depending on your priorities.
With lab grown: You’re looking at a well-cut 1.5–2 carat, G-H color, VS1-VS2, IGI certified stone from James Allen or Clean Origin, with $400–$600 left over for a quality setting. That’s a visually impressive, ethically sourced, scientifically real diamond.
With natural: At $2,000 for the stone alone, you’re in the 0.7–0.9 carat range, probably G-H, SI1-SI2, which is respectable but noticeably smaller. You’d need to decide if rarity and resale consideration outweigh the size difference.
Neither choice is wrong. They’re different value propositions for different buyers.
From a fellow buyer who’s been down this research rabbit hole: The lab grown diamond market in 2025 is genuinely mature enough to trust — but only if you buy from vendors with independent third-party grading reports (GIA or IGI), verify those reports directly online, and go in with clear eyes about resale value. The technology is real, the savings are real, and the sparkle is absolutely real. Just don’t let a slick sales pitch skip you past the paperwork. That’s where the actual protection lives.